
 Lessons: 13Length: 1.2 hours
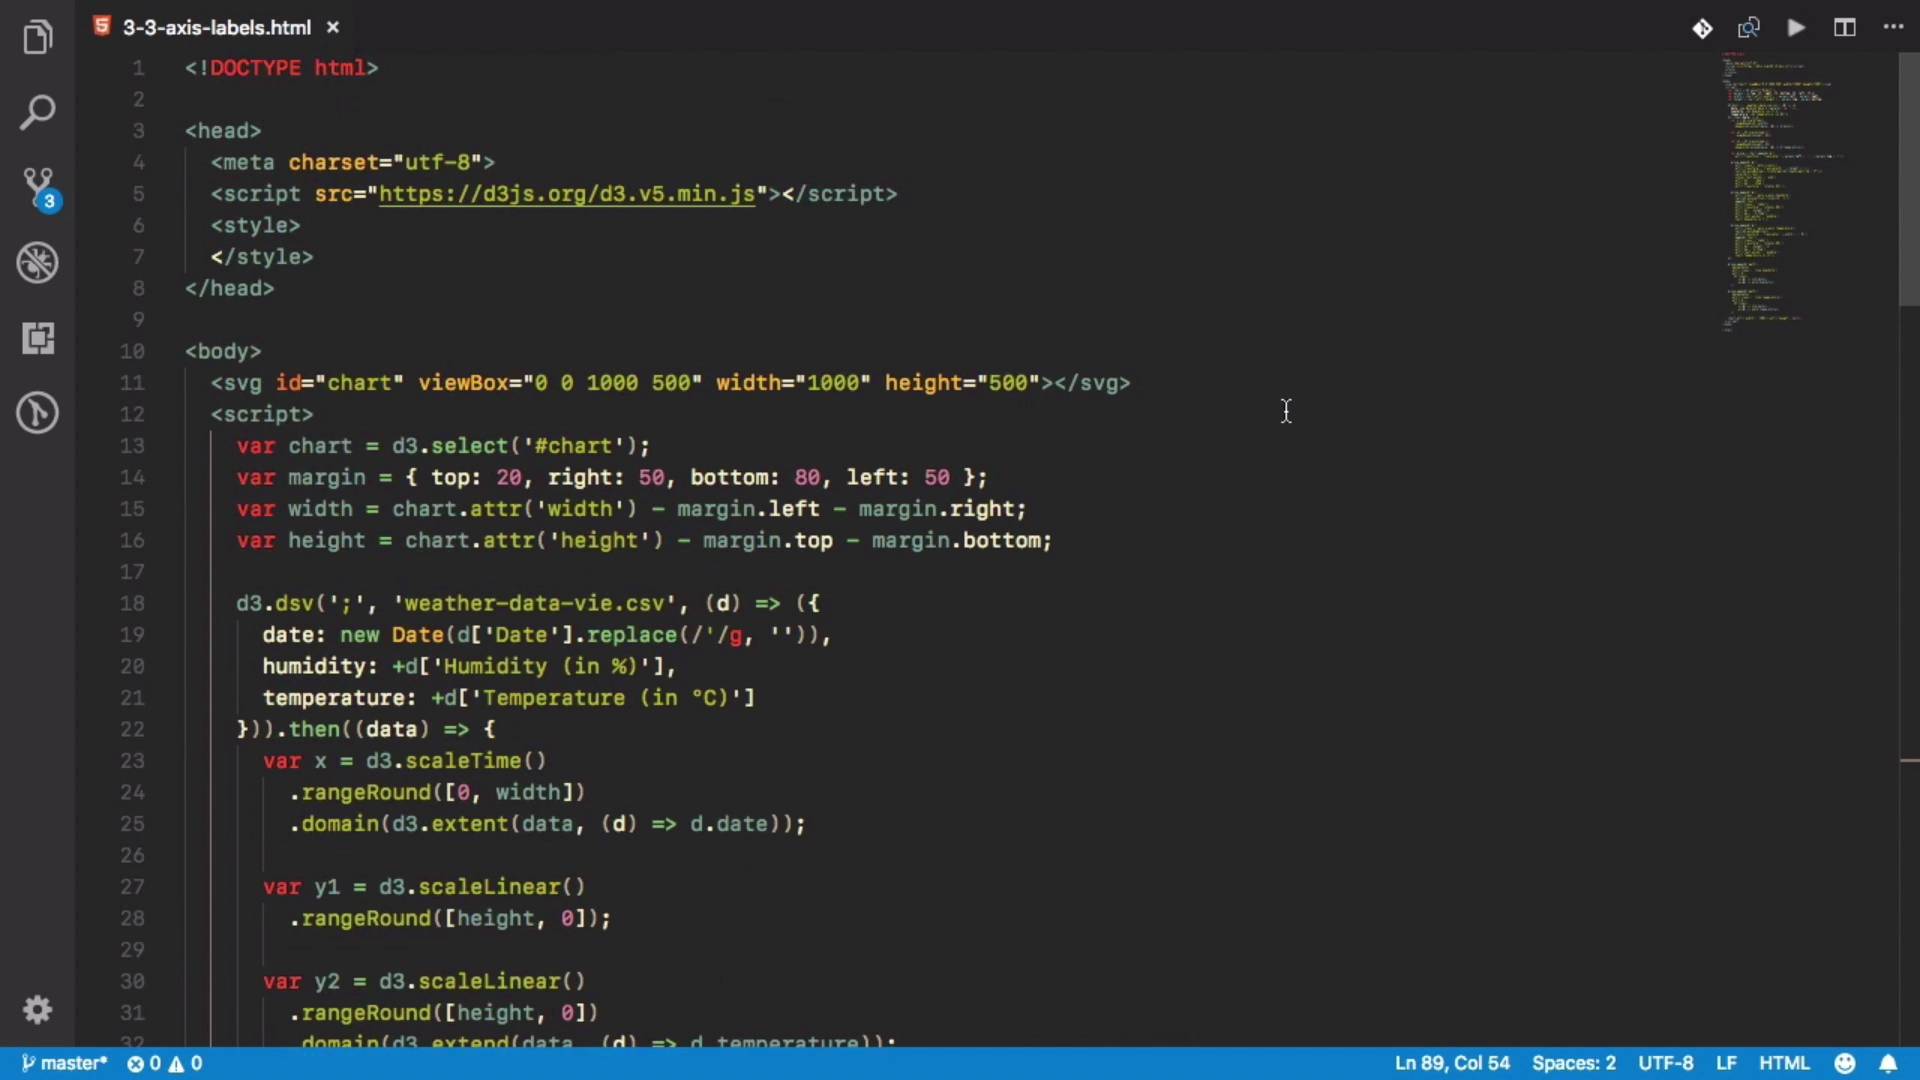

- Overview
- Transcript
3.3 Multiple Axes and Smoothing
Whenever one or two axes aren’t enough, you can always use more. In this lesson, I’ll show you how to use multiple axes to compare different data sets.
Related Links
1.Introduction
1.1Introduction01:20
1.1
Introduction
01:20
2.Getting Started
2.1Installation and Configuration08:16
2.1
Installation and Configuration
08:16
2.2SVG Basics07:44
2.2
SVG Basics
07:44
2.3Adding Data04:04
2.3
Adding Data
04:04
2.4Animations and Interaction Basics03:54
2.4
Animations and Interaction Basics
03:54
3.D3.js Basics
3.1Continuous Scales09:19
3.1
Continuous Scales
09:19
3.2Ordinal and Other Scales06:36
3.2
Ordinal and Other Scales
06:36
3.3Multiple Axes and Smoothing10:59
3.3
Multiple Axes and Smoothing
10:59
3.4Area Charts03:47
3.4
Area Charts
03:47
3.5Pie and Donut Charts05:17
3.5
Pie and Donut Charts
05:17
4.Advanced Features of D3.js
4.1Advanced Chart Types04:01
4.1
Advanced Chart Types
04:01
4.2Linked Views08:25
4.2
Linked Views
08:25
5.Conclusion
5.1Conclusion01:15
5.1
Conclusion
01:15


