
 Lessons: 13Length: 1.2 hours
- Overview
- Transcript
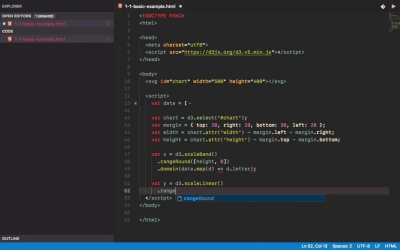
2.1 Installation and Configuration
In this lesson, I'm going to show you different ways of adding D3 to your project. We'll start with a simple chart to kick off the course.
1.Introduction
1.1Introduction01:20
1.1
Introduction
01:20
2.Getting Started
2.1Installation and Configuration08:16
2.1
Installation and Configuration
08:16
2.2SVG Basics07:44
2.2
SVG Basics
07:44
2.3Adding Data04:04
2.3
Adding Data
04:04
2.4Animations and Interaction Basics03:54
2.4
Animations and Interaction Basics
03:54
3.D3.js Basics
3.1Continuous Scales09:19
3.1
Continuous Scales
09:19
3.2Ordinal and Other Scales06:36
3.2
Ordinal and Other Scales
06:36
3.3Multiple Axes and Smoothing10:59
3.3
Multiple Axes and Smoothing
10:59
3.4Area Charts03:47
3.4
Area Charts
03:47
3.5Pie and Donut Charts05:17
3.5
Pie and Donut Charts
05:17
4.Advanced Features of D3.js
4.1Advanced Chart Types04:01
4.1
Advanced Chart Types
04:01
4.2Linked Views08:25
4.2
Linked Views
08:25
5.Conclusion
5.1Conclusion01:15
5.1
Conclusion
01:15


