
 Lessons: 13Length: 1.2 hours
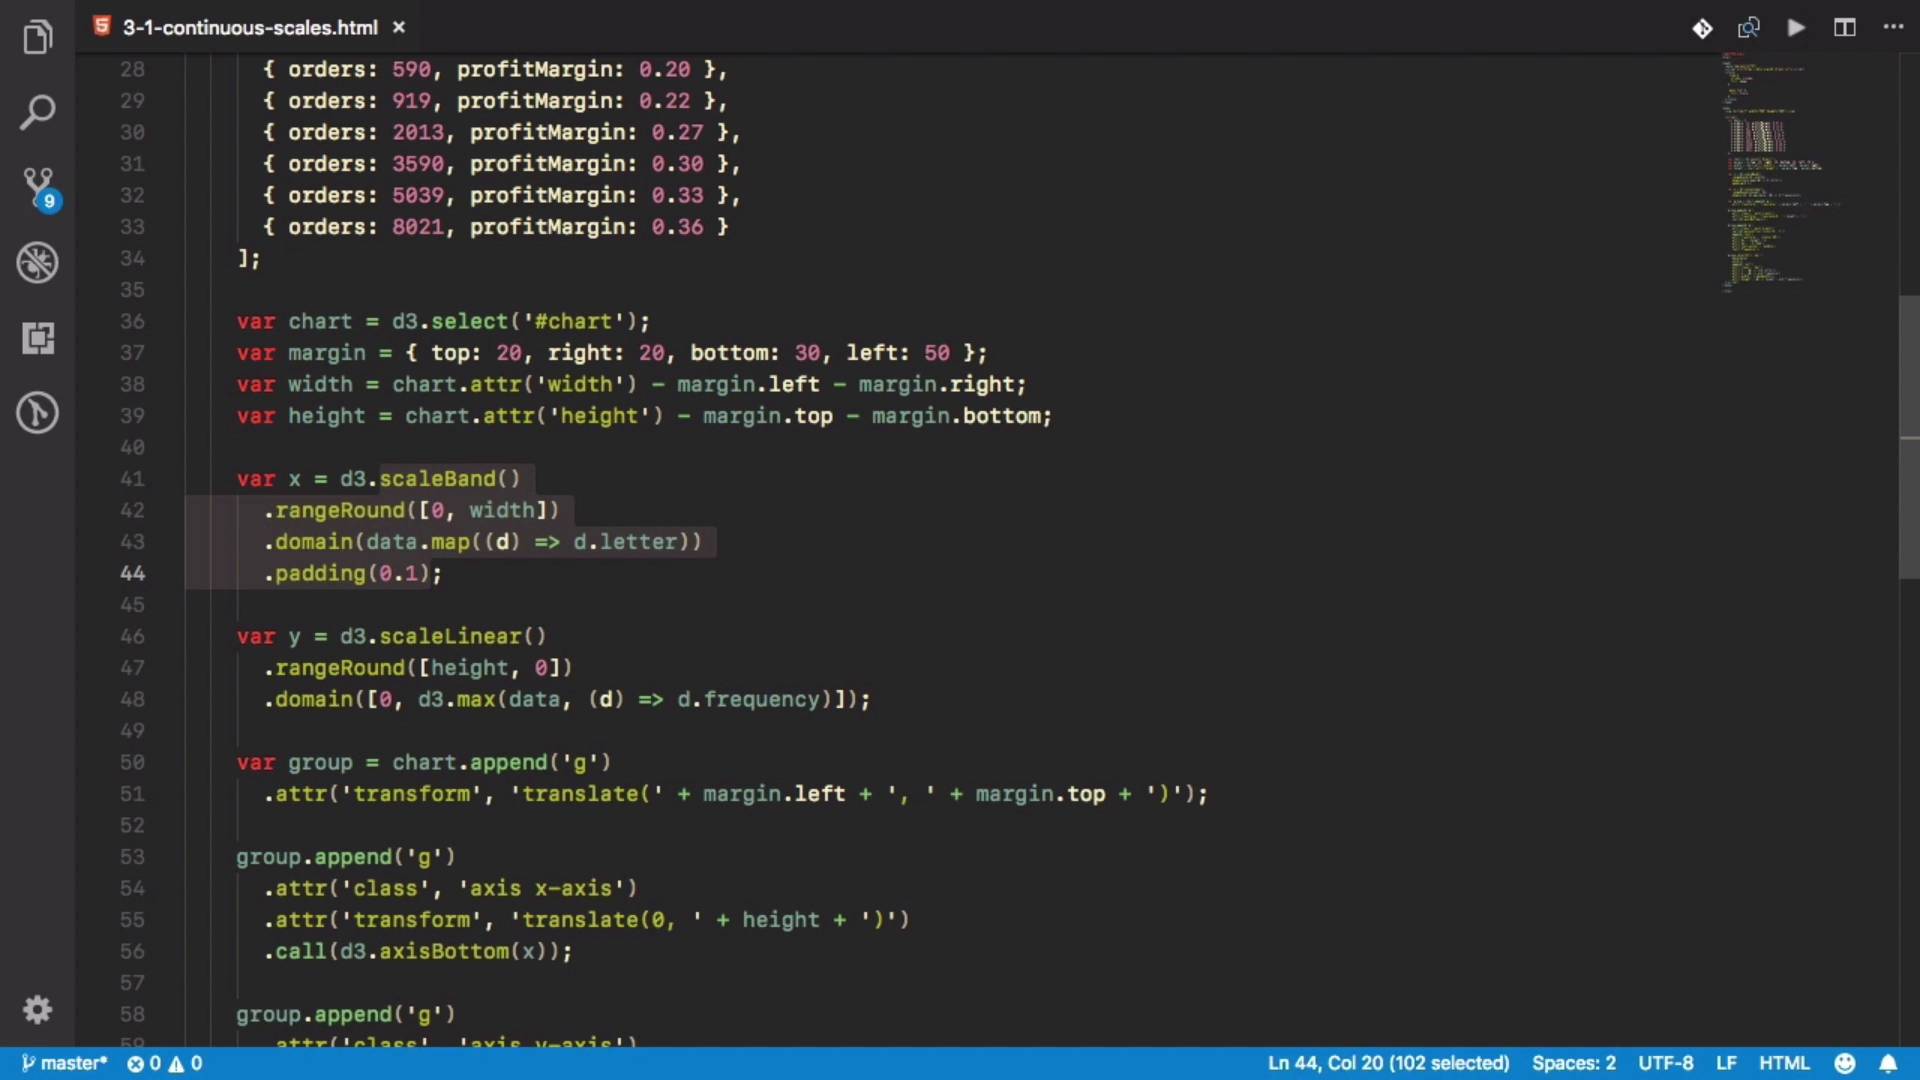
- Overview
- Transcript
3.1 Continuous Scales
There are a lot of charts that use continuous scales to show data that can have any value in a range. In this lesson, I’m going to show you one of them and explain scales in more detail. You’ll also get an introduction to D3’s interpolate module.
Related Links
1.Introduction
1.1Introduction01:20
1.1
Introduction
01:20
2.Getting Started
2.1Installation and Configuration08:16
2.1
Installation and Configuration
08:16
2.2SVG Basics07:44
2.2
SVG Basics
07:44
2.3Adding Data04:04
2.3
Adding Data
04:04
2.4Animations and Interaction Basics03:54
2.4
Animations and Interaction Basics
03:54
3.D3.js Basics
3.1Continuous Scales09:19
3.1
Continuous Scales
09:19
3.2Ordinal and Other Scales06:36
3.2
Ordinal and Other Scales
06:36
3.3Multiple Axes and Smoothing10:59
3.3
Multiple Axes and Smoothing
10:59
3.4Area Charts03:47
3.4
Area Charts
03:47
3.5Pie and Donut Charts05:17
3.5
Pie and Donut Charts
05:17
4.Advanced Features of D3.js
4.1Advanced Chart Types04:01
4.1
Advanced Chart Types
04:01
4.2Linked Views08:25
4.2
Linked Views
08:25
5.Conclusion
5.1Conclusion01:15
5.1
Conclusion
01:15


