
 Lessons: 15Length: 1.5 hours
- Overview
- Transcript
3.2 Timeline
The speed of the network isn’t the only thing that affects your page—how fast the page renders also plays a huge role. In this lesson we’ll explore the Timeline Panel to understand how to catch out performance issues with the drawing of our content.
Related Links
1.Introduction
1.1Introduction02:45
2.Development Workflow
2.1Elements10:58
2.2Sources and CSS06:26
2.3Sources and JavaScript07:55
2.4Console06:12
3.Performance
3.1Network06:28
3.2Timeline07:13
3.3Profiles04:38
3.4Layers and Rendering10:08
3.5Audits04:07
4.DevTools and Mobile
4.1Emulation03:23
4.2Remote Debugging06:41
4.3Responsive Design05:21
5.The Resources Panel
5.1Resources02:31
6.Conclusion
6.1Extensions and Conclusion05:57
3.2 Timeline
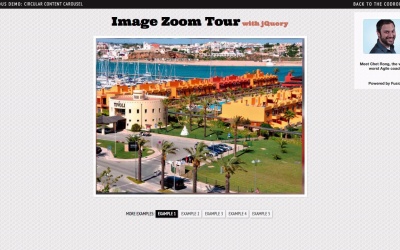
Hey everyone, welcome back. In this lesson, we're going to take a look at the timeline panel. So actually right now, I'm on my Twitter profile page, and I'm going to use this as an example of some timeline recordings to judge performance. So, the timeline panel is the go to place for rendering performance. You know how we kind of looked at the network panels to see what resources are taking a long time to download, for example. With the timeline panel, you can actually record sessions and find out what records are taking a long time and why. And we're gonna take a look at that in this lesson. Let's familiarize ourselves with the timeline, anyway. At the top we've got a few controls, I like to stick with frames mode, which is this one, but each bar is essentially a frame, but you may prefer this mode. We can clear our current recording, [UNKNOWN] to the network panel, start a new one. You've also got filter options here and this is very useful because this is, is essentially a legend where the colors that you see as part of these records correspond to the label that you see here. When we record a timeline session, we can actually select portions of it by clicking and dragging the mouse. And just a single click will typically select one frame. Each one of these vertical bars you see is a frame. Within a frame, you can have a number of records. Now a frame is essentially something the browser had to do to update your screen. And inside the frame we roughly have 16 milliseconds to do all the activity we need. Why 16 milliseconds you ask? Well, that's because if we're updating the screen at 60 frames per second that's 1,000 milliseconds divided by 60, 16.6, basically 16 milliseconds to do all your activity for a single frame. And that's actually not a lot considering how heavy JavaScript is on some modern web applications. Within a vertical frame you have a bunch of records and all of those are listed here, you can click on Records to see more information. But just to start out let's select some frames and we get an overview in this nice pie chart where our time has been eaten up. In this it's very clear that painting is taking significant time. I want to actually start fresh recording so I'm gonna clear, start record and scroll a bit and stop recording. It's important to keep your recording short so what you see here isn't just noise. I'm gonna select one bar which clearly blew our frame budget and also keep in mind this is a powerful machine. And I'm going to scroll down these records to find out what's going on. Now we know paint is what's taking time, so let's have a look at this paint record. We can open it up, and we see an image decode. Now this is kind of insane when you think about it. It took 22 milliseconds just to paint an image. Now what image could that be, and why did it take so long? What's really useful, is we get the exact image which caused this issue to occur, and it's clickable. So let's click on it. And huh, this is interesting cuz this is actually my fault I pasted this treat a while ago, I think I was showing how you could copy the stack trace, of course, stacks, when paused at a break point. And if you look at the bottom, you'll see that the dimensions are kind of ginormous. And now, it's starting to make sense at what happened. When you serve the browser a very large image, it has to do a fair amount of work to resize it and that's exactly what's happened here. What's really cool about this details ping is we can even, click on the image element and be taken to that dom load in the elements panel. And if we want to find where it is exactly we can right click and scroll into view. And there it is. I'll go back to the timeline. It's not just painting which takes time. It's also JavaScript and that's typically seen as the yellow records because remember, yellow is scripting. Instead of tutor, I want to show you a different page. So here's a really cool jQuery plug in on the [UNKNOWN] website. And the idea is you have this image and you can click onto it and zoom and it does this like amazing effect. And I really like it. Let's find out how this performs. I'll open up the dev tools. The screen is positioned in such a way where, as soon as I hit Record, I can go and do my action, but keep in mind you can also use a shortcut, Cmd+E, to start a recording. Well we can immediately see that 17 milliseconds was spent on scripting, this is kind of a big deal. Again when you consider this is a reasonably powerful machine, but more pointedly, on mobile, this isn't gonna perform well whatsoever. So, we're after JavaScript activity which occurred after the click. And we can see here that there's a click event, and it's got a little faded out triangle. If we open that up, you actually get triangles which are more colored, and basically, the idea is, if you see a faded out triangle, that signifies that this parent has children with these warning icons. Now here's where it gets interesting, we'll click here, and as you can see, the details ping is full of information. We can actually see the entire course step of what triggered this record to occur. And this is extremely powerful cuz we can basically draw down, and when I say draw down, I mean go to the line of code which caused that record to occur. So if we browse through this we see a lot of jQuery activity and then we start to see some possibly website specific code, which should hopefully indicate to us what is causing this record to occur. So click on this zoom tool, and I see it's calling in the apply style. I'll go back, now do the one right above jQuery.transform, and what we can see here is this method called apply style was called. If we do a search for the definition of this, we can see that it's called in jQuery animates our CSS function, both of which have caused a layout to occur. Now when possible, keep in mind it's not always going to be possible, you want to try constant reads and rights to the dom. If you can, patch this up, read from the dom, get the source of true frey at the beginning and then do your writing. If we scroll all the way to the bottom of this ping, we even get a little warning, forcing [UNKNOWN] layout is a possible performance bottleneck. And this is basically saying that this record right here is synchronous, the barrels have to stop what it's doing to lay out the items on the page. But again, don't get me wrong, that's not to say that we shouldn't be doing this, it's just understanding the problem of performance is half the battle in my opinion. Let's go back to sweater. I wanted to show you a little tip. If you find that for example, paint records are taking an unusually long amount of time, head over on to the elements panel, and find an element which you think could be the culprit of all this. Now, I'm just messing around here, of course, this isn't, a stable solution. Let's make a new selector with image and cause it to display none, and I'll probably have to important that. Okay. Now go back to timeline, clear and start recording. And I dont' know if you noticed, but these frames are carrying a lot quicker which is good. So the thing that I wanted to highlight there is you can go to the dom tree view, and basically hide elements. A short cut to do this, is to select an element and hit the H key. As you can see, I place a web inspector short cut, which gives a visibility of hidden. This is useful for really finding culprits which are contributing to poor performance of your web app. So to recap, timeline panel is great for the render performance of your page. You've got a few controls here. Always clear, and then start a fresh recording when you want to analyze things. You can use filters and the legend to understand what's going on, and you can toggle these on and off should you so wish to. Vertical bars are frames, and within a frame are records. You can single click on a frame, and that will give you a pie chart and a lower overview of where the time is being spent, you can click on individual records and that will give you further information. And in the case of JavaScript, like on the page that we saw earlier, we even get call stacks of the exact line of code that calls that record to execute. That's all for now, I'll see you in the next lesson


