
 Lessons: 15Length: 1.5 hours
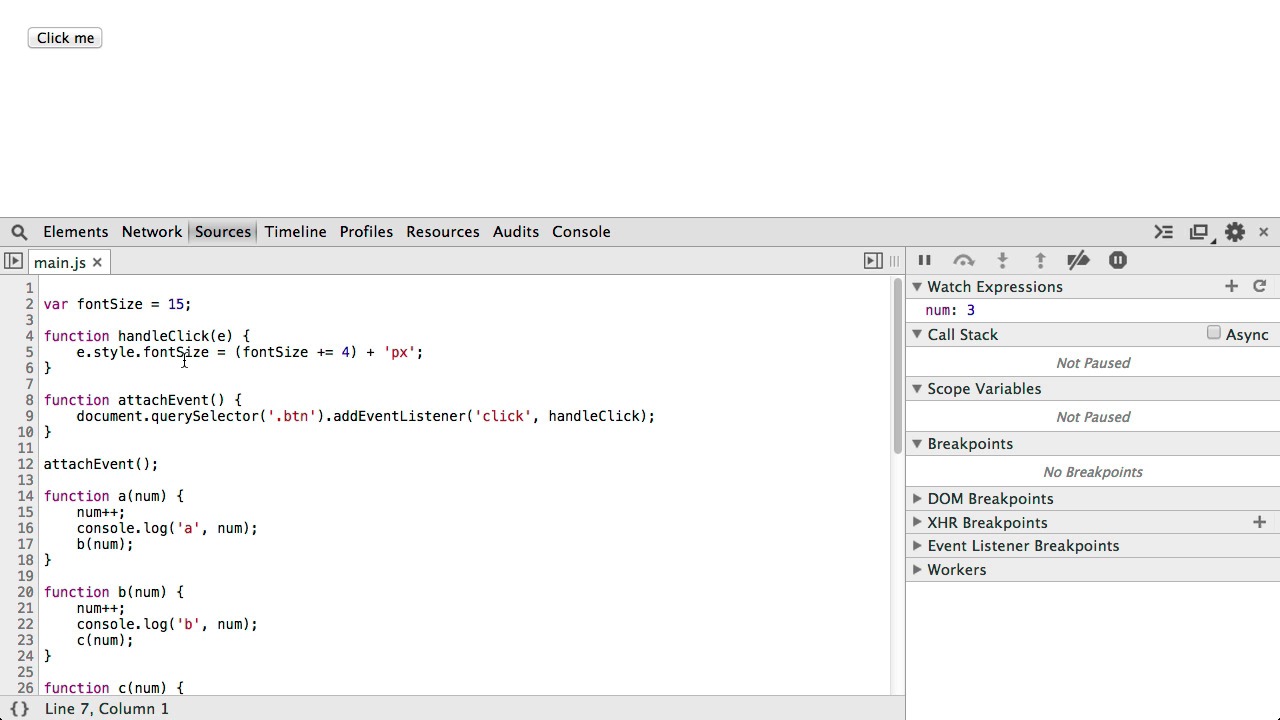
- Overview
- Transcript
2.3 Sources and JavaScript
The Sources Panel doesn’t just end with CSS, you can also use it for JavaScript editing and debugging.
Related Links1.Introduction
1.1Introduction02:45
2.Development Workflow
2.1Elements10:58
2.2Sources and CSS06:26
2.3Sources and JavaScript07:55
2.4Console06:12
3.Performance
3.1Network06:28
3.2Timeline07:13
3.3Profiles04:38
3.4Layers and Rendering10:08
3.5Audits04:07
4.DevTools and Mobile
4.1Emulation03:23
4.2Remote Debugging06:41
4.3Responsive Design05:21
5.The Resources Panel
5.1Resources02:31
6.Conclusion
6.1Extensions and Conclusion05:57
2.3 Sources and JavaScript
Hello, welcome back. In the last lesson, we had to look at the Sources panel, but from the CSS point of view. Now we'll have a look at it from a Ja, JavaScript point of view. I think I'll hide this left sidebar since it's mainly used for showing the file structure. I've got a very simple main.js file. In this main.js file, there are a few things going on, but they're very simple and I've made it so simple so that I can demo a few features of the JavaScript debugger quite easily. To start out, I want you to pay attention to these three functions. We've got function a, b, and c. a is first called right at the bottom, a calls b, b calls c, and finally, c returns a number. Let's have a look at the results of this. [BLANK_AUDIO] As you can see, the results are 2, 3, and 4. That makes sense since we pass 1, 1 gets incremented, and so on. I've put this trace in there just to show you what it does. console.trace is very useful to see the call stack which occurred up to the line of code where you put the console.trace statement. And as you can imagine, for larger web applications, this can be very useful. But what's cool is these method calls actually show you the order in which they were called. So, from the point at which we have the console.trace, we see that c has been called. That's why c is right at the top. b was called right before that, then a. And we can actually click on these to go straight to the line of code where that occurred. Very useful. Let's have a look at breakpoints. Now, setting a breakpoint is a simple as clicking in the line gutter. When you set a breakpoint, you tell the JavaScript VA engine, hey, pause what you are doing. Don't carry on with your JavaScript execution because there are a few things I want to figure out. Remember, you don't just have to set a breakpoint when you're trying to solve an error. It can just be to explore the code path which is going on. Now in this case, I've set a break point, but we haven't paused at it. That's because it only happens on page load. Let's reload the page. And as you can see, we're paused at a breakpoint. We know this because the page is paused in debugger, and this line is highlighted blue to signify this is the line of code where we are paused up. I'm gonna open up a few of these panes. First of all, notice that in Scope Variables, step tools tries to be helpful to us and shows us local variables which are in scope. This num isn't a global variable. It's scoped. Not only do we get the value here, but we can also open up the console panel and type in num to see what the value is. If there's a variable you're interested in, you might wanna use Watch Expressions if it's not already displayed in Scope Variables. To add a watch expression, click on the plus button, then add the name of a variable you're interested in. This will update as you step through the code. Now, let's have a look at some JavaScript controls. To start out, we've got Step over next function call. This kinda does what it says on the tin. We click it and it carries on stepping through each line in our function. But as soon as we make an external function call, guess what? ? It steps right over and then basically continues. Use this, that being Step over next function call, when you're only interested in the current function that you're debugging, but not in the external functions. Let's reload the page again. Okay. Let's say we are interested in the current function, but also any functions that the current function calls. To do that, we use Step into next function call. And again, it does what it says on the tin. It will step into the next function. So here, we're stepped into b, and we can carry on doing that and we'll also step into c. Let's say we're not interested anymore. We can hit this sort of play button and that will resume script execution. So that completely exits out the debugger. The ability to step into function calls and out of them is very powerful when debugging your JavaScript. Note that if I'd set breakpoints here, they also appear in this Breakpoints pane. I want to remove them and I'll select Remove All Breakpoints. We've had to look at these function calls. Now let's took, take a look at something else. Here I've got a function called attachEvent. AttachEvent finds a button, which is this button right here, and calls an event listener. We register an event listener, and when click is called, we call handleClick. handleClick isn't very fancy. It basically increases the font size by 4 each time it's clicked on. So let's click on it [BLANK_AUDIO] Hm, that's strange. We can see this JavaScript error. If we open up the console, we get the same thing. What's nice is you can click here and actually be taken to the line of code where this error occurs. And again, as you can imagine with larger web applications, this is very useful. So we want to debug this. We'll set a breakpoint. Click and we are paused. We can immediately see what the problem is. I've called e.style, whereas I should have called this.style because this is the current element, whereas e is just an event object. Okay, what do I do now? Well, normally, I'd go back to my code editor, make the change, come back, and refresh. Well, check this out. I can actually remove this e and simply retype what I need. I'm gonna bring up the Console panel and I want you to watch carefully cuz I'm going to hit Cmd+S. Now, what I've done here is I've made a change in real time, and thanks to live edit, the dev tools will actually re-inject the source back into the V8 engine. And that will happen in real time, and I can just carry on using my page like normal with the new version of the JavaScript. I'd like to touch upon something else. When I hit this Click me button, as you saw earlier, we were increasing the font size. Now, I want you to take a different approach of debugging. Let's imagine that we're debugging from the outside in. We don't know what the code looks like. Yet, when we come to the Elements panel, we click here and we clearly see an attribute is being modified. So how can we discover the line of JavaScript which is causing that? Well, you can actually break on what's called an attribute modification. And on top of that, you get node removals for when something gets removed, and subtree modification for when child nodes of a parent node that you've selected have been modified in some way. So we'll select Attribute Modification. Hit Click me again, and as you can see, we're taken straight to the line of code which caused an attribute modification. And in the Call Stack, we're explained the reason that this happened. Did you know, in addition to setting attribute modifications, subtree modifications and so on, you can also set other breakpoints? This includes XHR breakpoints. If you know that an AJAX request is occurring but you wanna know what is causing that, come to the XHR Breakpoints pane, click plus, and I'm gonna hit Enter to break on all requests. I'll reload the page, and as you can see, I've paused right at the point when an AJAX request was about to be executed, and I even get a call stack to see what was called before that. In addition to the DOM breakpoints that we saw and the XHR breakpoints that we saw, in fact, I'll remove that right now and resume script execution, we can also set event listener breakpoints. More event listener breakpoints. Well, consider the case that you've registered an event listener and you've called a callback. What happens if you know that an event is being triggered and you want to instruct the dev tools to break when that occurs? Well, here's a todo list. If I add an item, they can clearly see that my keyboard actions are affecting the state of the application. So therefore, keyboard event listeners are definitely involved. Let me set a event listener breakpoint for keyboard, and I'll simply press a key. And as we can see, just like that, we've paused at a breakpoint because of our event listener breakpoints. So to recap, when you wanna debug from the outside in, don't forget you can set event listener breakpoints for when you know an event is being triggered and you wanna sort of hook into the line of JavaScript which receives that event and does something via a callback. You can also set breakpoints by simply clicking in the line gutter. You can also go to the Elements panel, and in the DOM tree view, right-click, select Break on, and choose the modification of your choice. One last thing which I'd like to very quickly show you is Snippets. Snippets is essentially a more improved console panel in the sense that you can write arbitrary JavaScript, kind of like a bookmarklet, and have it execute in the context of the current page. So here, I've taken some code from a repository called DevTools Snippets. Do check it out. And I'm gonna run it by right-clicking and selecting Run. And as you can see, all that happens is that it executes in the Console panel. And this, in particular, tells me what colors are being used in the current page. So these are kind of fun to use and good to be aware of.


