
 Lessons: 15Length: 1.5 hours
- Overview
- Transcript
4.2 Remote Debugging
One of the best ways to test your page on mobile is to use an actual device. In this lesson we’ll use remote debugging to hook up to a connected device and inspect it remotely.
Related Links1.Introduction
1.1Introduction02:45
2.Development Workflow
2.1Elements10:58
2.2Sources and CSS06:26
2.3Sources and JavaScript07:55
2.4Console06:12
3.Performance
3.1Network06:28
3.2Timeline07:13
3.3Profiles04:38
3.4Layers and Rendering10:08
3.5Audits04:07
4.DevTools and Mobile
4.1Emulation03:23
4.2Remote Debugging06:41
4.3Responsive Design05:21
5.The Resources Panel
5.1Resources02:31
6.Conclusion
6.1Extensions and Conclusion05:57
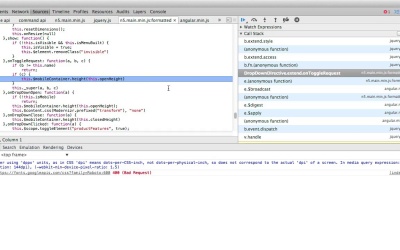
4.2 Remote Debugging
Hey everyone, welcome back. In this lesson, we're gonna take a look at remote debugging. So, here I am on the Nexus 5 landing page. That's the URL. And as you can see, it's a nice page, and it's got a bunch of snazzy effects. Now, unsurprisingly, snazzy effects tend to work pretty well in desktop, but not so well in mobile devices. So, we're going to utilize remote debugging, to find out how we can discover such issues. First, I will right-click and Inspect Element. So we've got the dev tools up. And as you'll see in the top right corner. I've got this little devices icon. It's telling me I've got one device found. So, I'll click on it. What's cool here is, it's brought up this new devices pane. Now, I should say that this is an experimental feature currently. But maybe when this course is released, this will be promoted to stable. Before I continue, I'll just let you know how I actually got this working. I enabled devices from the experimental settings. And then I connected my Nexus 4 device, via USB cable to my laptop. My device isn't rooted, however, I did have to enable developer mode. And that's all documented on the developer tools remote debugging documentation. Finally as mentioned in the intro I'm using Chrome Canary. And on my device I'm using Chrome Beta for Android. So let's get to it. I'll click Try here, and as you can see a brand new devtools window has actually opened up. Now here's what's actually's happened. By clicking Try here, it took the current page I was on, in other words the Nexus landing page, and it opened that page on Chrome Beta for Android on my device. Now before making this lesson, I was figuring out how I can show you this. One option is to use a Webcam to record the device. But I actually wanted to demonstrate another feature of devtools, and at the same time, use it to show off my device. And to do that, I'm gonna use a feature called screen casting. So in the top right corner, I've got this little screen cast icon and I'm gonna click it. And what continues to amaze me is this is an actual realtime preview of my device. Right now I'm scrolling it, and as you can see that's reflected in realtime, which is really great. And I can also scroll the device here, and so scroll commands are actually sent directly to that webpage from the devtools, and you get this nice bidirectional communication between the two. One thing I do want you to take note, is to do all that I didn't have to touch my device. Of course I touched initially just to wake it up and also open up Chrome for Android. But apart from that, the opening of the page, the scrolling of the device and interacting with it, this is all done from devtools. Here we've got a little drop down. You click it and some stuff opens up, and you can close it again. Now if you're watching closely in the DOM Tree view, that's on the right side right within the elements panel, you'll see a little attribute is being modified. And that's the height property. This is clearly being done by JavaScript, but how can we investigate? Well using the debugging from the outside in techniques that we learned earlier, as you know we can right-click and select Break On and choose Attributes modifications. So I'll select that, I'll click here and before anything opens up, we immediately pause thanks to the debugger. We don't particularly need the screen cost view. So I gonna hide it for now, and I'm gonna hide that power tree view. I'll open up the console with escape, and we're ready to do some debugging. All we wanna do is find out from where that height property was being set. So as you can see we get the call stack and there's a lot of jQuery here, so I'm gonna go through this and I see some code coming from main.min.js but this is all minified and. And I don't really wanna look at this, so we can pretty print that. And as you can see, the Source-files that are being referenced here are slightly different. It's got the formatted word in there. And so that should help us. Here I am at this on toggle request method in the call stack. And as you can see, we have this.mobile container. I'm gonna select that portion, right-click and evaluate in console. I'll use, $_ to reference that last variable and see what available methods there are. Off the bat, this kind of looks like a jQuery object, so it kind of makes sense what's happening now. On this .mobile container, which is that DOM element that we'd broken, it's setting the height. And the height in question, is 472. I'll resume script execution, go back to the elements panel, and we can see indeed the height was 472 pixels. So what's the point of all this? Well, it goes to show that even that something called a mobile device. Where in the past these could have been very tricky to debug, that was already straightforward. And better yet, really convenient. Another huge benefit which is pretty important to mention when doing a remote debugging, is all the performance metrics you collect are actually gonna be directly from the device. And this is huge. So what I'll do is I'll start a Timeline recording. Start scrolling, and you can immediately see. That these bars are pre-populated. If I was doing this on my desktop, they probably wouldn't be as full. Because, well, my machine is fairly powerful. And we can go into these bars just like you would expect. And we can see right here, that there's this massive paint. And if we click through, we even get the elements in question. Don't forget we can even click on these elements, to find out what node in question caused such a record to occur. You might find it really helpful to integrate this into your regular development work flow, to make sure that you're collecting performance metrics as you go on. We can also see this little warning icon which we covered earlier when looking at the timeline panel. Drill into that and we get all these reasons, for why a star calculation was forced. As you can probably guess it's pretty important to collect a network trace directly from the device, because this will give you much more accurate representation of what your users might experience. So I'm gonna clear this and hit Cmd+R. The page reloads and I'm gonna hide the screen cast since we don't need it. And as you can see 0.4 seconds, okay that's not too bad. But there's something really important to take note of here. And that's the status column. There's a lot of three or four not modifieds. And this is risky, because we don't wanna rely on these stats too much as we have a lot of items in our cache. Let's disable the cache, clear and command or again. And now, as you can see, there are a ton of resources being downloaded that's 76 requests and almost 5-megabytes of data being downloaded. If we sought by size, we might be unsurprised to learn that the biggest culprits are images. It would definitely be worth putting these for a tool like image optimal, image alpha to try and optimize it. Let's do a quick recap. I will close this. So with the page open you can open up the developer tools. And after enabling the devices pane, you can click on this devices icon, or you can hit the escape key and you'll see it right there. Or try and connect to your device and as long as you've got developer mode turned on, you can click Try here. A brand new devtools will open up, and this will be the devtools that is connected directly to the page on Chrome for Android. You can click The Screen Casting Icon and Control your device right here. Or as I'm doing right now you can scroll it on the device and it will be reflected here. Inspect element works just as you would expect to let the magnifying icon, select images and that just works. It's almost always worth collecting network traces and timeline recordings, because you'll get a much more accurate representation as to what your users might be experiencing. Thanks for watching, I'll catch you in the next lesson.


