
 Lessons: 15Length: 1.5 hours
- Overview
- Transcript
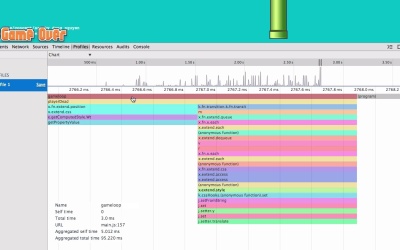
3.3 Profiles
With Flame Chart visualizations and Canvas Inspection, we’ll take a visual approach to the profiling of our page.
Related Links1.Introduction
1.1Introduction02:45
2.Development Workflow
2.1Elements10:58
2.2Sources and CSS06:26
2.3Sources and JavaScript07:55
2.4Console06:12
3.Performance
3.1Network06:28
3.2Timeline07:13
3.3Profiles04:38
3.4Layers and Rendering10:08
3.5Audits04:07
4.DevTools and Mobile
4.1Emulation03:23
4.2Remote Debugging06:41
4.3Responsive Design05:21
5.The Resources Panel
5.1Resources02:31
6.Conclusion
6.1Extensions and Conclusion05:57
3.3 Profiles
Hello everyone, welcome back. In this lesson, we're gonna take a look at the profiles panel. So right here, I'm on this Flappy Bird game, and I'm gonna record a JavaScript CPU profile. JavaScript profiles are really good to capture because it shows you exactly where the time was spent within your JavaScript code. We're mainly going to focus on JavaScript CPU profiles and canvas frames. To start out, I've loaded a Flappy Bird game written in JavaScript, which is really fun. And I'm gonna make the bird fly a bit by clicking around, and while I do that, I'll record a JavaScript CPU profile. So I'll play, start, and up a bit, maybe let him fall, and then stop. First of all, let's make this bigger. And you might immediately notice some similarities with the timeline panel. In the sense that at the top, you have an overview of the activity. You can select and drag to really zoom in. And just like how in the timeline panel, you would have records here, you can kind of think of these as records. But instead of records, they're actually function calls. So first of all, let's zoom in. I'm actually using the mouse scroll wheel to zoom in here. Everything you see here are function calls. By hovering over a function call, you get some details about its statistics. You get the function name. And the function at the top of the list is essentially the first function that was called. Then update player was called, then CSS was called on jQuery, and so one. What's really nice is we can click right here, and go straight to that function's definition. So as you can see, we clicked on gameloop and we've arrived at gameloop. Let's go back. In terms of understanding this, it's important to note, that the height of the list doesn't matter so much. What does matter is the width, because the width signifies time. And one function that's a lot longer than all the others, could be cause for concern. Let's have a look at the stats and see what they mean. So as you can see, in the bottom left corner of this view, we get the function name, and we get the self time. Maybe I'll take a look at something that's got a bit more of activity. Like here, I'm gonna zoom in. And by the way, you can also pan around. That's where we were. If you hover over a function call, you get stats. On top of the name, you get the self time, now the self time, is how long it took for that current method invocation. However, the total time, is slightly different. It's the current invocation, including any functions that it called. Cuz by default, the self time, won't include the time that external function calls took. Aggregated self time, is very similar to self time, in the sense that it's how long the current function took, but all invocations of it in your current recording. And likewise, aggregated total time is all invocations of the current function within your entire recording, including any external function calls it made. Don't forget we can click on any one of these. If you see something amenified, you can pretty print it right here. And that is the flame trial visualization. Now let's take a look at canvas profiling. So here I've got this just mind blowing demo, it's webGL racer, and you can ever drive this car which is really crazy. And what I wanna do is, I wanna show you canvas profiling. So i'll bring up the dev tools, and on the profile tab, I've already enabled canvas instrumentation in dev tools experiments. And first I need to enable it here. The page will reload, and I'm gonna capture the canvas frame, and take snapshot. I'll make this a bit bigger. Now, the first thing you'll notice, is we actually get previews of something which looks like it was in the page originally. And it turns out that it was. We're getting previews of how this canvas was actually drawn up. And as you can see, there are the wheels, here's the body. And, and it's really fascinating to see. You can navigate this with the arrow keys. Each one of these parent items is a draw call group. A draw call group has individual draw calls, and a draw call is essentially something you call on the canvas context. If you have multiple canvas contexts, you can select what one you prefer right here. If I click here, I get this pane on the right hand side, and that shows me the current property states. So this is really good for a canvas debugging. Can also click on this location field, and that will take you to the line of source code. In this case, the submitted files are not totally helpful, but we can always pretty print. For those who haven't used WebGL before, you can think of these as calls you would make to the context such as DrawRect, to draw a rectangle, for example. But if you're working on a game or a 3D visualization, and you're using the HTML five canvas, and or WebGL, you might find that this is a really powerful tool to do your debugging. When looking at individual draw calls, have a look at the property states and notice something interesting. If we cycle through here, what you'll see, are properties which have changed, are actually highlighted in yellow. And this is really useful to quickly understand what is being changed throughout these draw calls. That's it for now. I'll see you in the next lesson.


