
 Lessons: 15Length: 1.5 hours
- Overview
- Transcript
3.1 Network
Performance debugging can come in various flavours. In this lesson we'll take a look at performance from the network side of things.
1.Introduction
1.1Introduction02:45
2.Development Workflow
2.1Elements10:58
2.2Sources and CSS06:26
2.3Sources and JavaScript07:55
2.4Console06:12
3.Performance
3.1Network06:28
3.2Timeline07:13
3.3Profiles04:38
3.4Layers and Rendering10:08
3.5Audits04:07
4.DevTools and Mobile
4.1Emulation03:23
4.2Remote Debugging06:41
4.3Responsive Design05:21
5.The Resources Panel
5.1Resources02:31
6.Conclusion
6.1Extensions and Conclusion05:57
3.1 Network
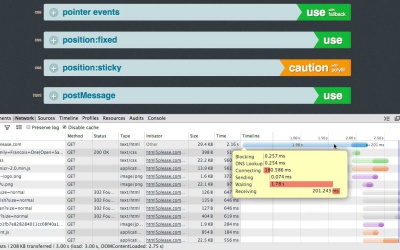
Hey everyone, welcome back. In this lesson we're gonna take a look at the Network panel. To start out, I'd first like to say that, please always disable your cache when recording network traffic, because you don't want to be getting cached resources, and, you know, not understanding when content has been updated. So, let's take a look at the UI of the Network panel. At the top we've got a few options, we've got the ability to toggle the view of these resource items. So, I prefer to display them as small items because you can fit more on the screen, and you've also got the ability to clear all the items that are already there. So again, if you're looking at network traffic and you're like, really gonna get into analyzing it, I would always clear what's already there. Right-click, reload the page so you have a fresh batch of resource items. Right under these controls we've got a bunch of filter items and I pull these up by clicking on the Filter icon. By default, it's hidden. So, you can select that and you can filter by certain item types. So, over here, I can see that a custom font is being used, but I don't wanna find that in this giant list. So, I can just click on Fonts and there it is. If I click on the font, it's quite nice cuz I actually get a preview. But we'll look into what these various tabs are in a sec. So these are all the filter items but what's really amaze is we've also got advanced filtering. So, see these little items as basic filtering, and see this as more advanced filtering. So, at the bottom I see a few Twitter images and I know that's coming from the Twitter domain. So, in this advance filtering box, I can select Domain, and what you'll see is you actually get auto complete for the available domains. So, this is very powerful. And you don't have to even hit Enter. You can just cycle through these. So, it's very convenient. I'll clear that and I'll hide this filtering bar. Right at the bottom we get a few interesting statistics. We see an overview of how many requests occurred. We see how much network traffic was actually transferred, the time it took. And more importantly we get the DOMContentLoaded and Load Events which is very useful when debugging JavaScript applications. Because a lot of what we do hooks into the DOMContentLoaded event. You'll find DOMContentLoaded is this blue bar and that's available on this waterfall chart which we'll get into in a sec. Each one of these items is displayed in a horizontal list, and you can click on an item and get more detailed information on what the item is about. So, to start out, we've got the Headers. Headers is very powerful. For example, if you're a service engineer or you're just a web developer and you wanna find out that the Gzip Header is being correctly sent. You can come here, see the Request Headers and see the Response Headers. I like to click View Source because this is a more rural text view of what's being sent, rather than a pause view which may modify the headers in an unexpected way. And recently we gained the ability to see the remote address, so this is useful because you understand the IP address of the server that's actually being hit. You get a Preview. Preview and Response are very similar. I believe on its JSON Response, Preview will actually format a bit nicer. You see cookies, as you know, that cookies are sent through Alt+HTTP requests, so this is useful to see what cookies are being transferred. And timing information which is pretty much the same as what you get in this waterfall chart. And what I mean by that is you can actually hover over these bars and you get detailed stats on the time it took for that resource to complete its download. When you see a fairly long waiting time but a short receiving time, this is kind of good in the sense that the resource isn't huge and it's downloading fairly quickly. But don't forget to always throttle your connection using something like Charles proxy, to make sure you're getting an accurate representation of what your users might be using. But when you do see a long waiting time, this could hint a problem with the server taking long to respond. So while we can click on each one of these items and get detailed information, we've also got some useful information right here. You see the method, the HTTP status, the content type, the initiator, which is very useful and I'll get to that in a sec. The size, time it took to complete. And you can also right-click here and enable more. So we can enable this cookies header and that will show us how many cookies were transferred per this request. I would definitely advise right-clicking and just experimenting with a few of these headers, finding out what's useful for you. Each one of these resources has a context menu. So you can right-click on the resource, you can open it in a new tab. You can Copy the Link Address, which is useful for sending it to someone. You can Copy the Request Headers, and that will just go straight into your Clipboard, which is useful if you need to again, send it to someone or paste it somewhere for diagnostics. One feature that I really like is the ability to Copy it as a cURL request. So let's find a resource to copy as cURL. I think I will do this one. This is nice and short. So I'll right-click, Copy as cURL, go to my terminal and Paste. And as you can see, that cURL request is executed with the same header information that the browser used originally, which is very powerful. Now I'd like to show you the initiator which is a feature I really like. The Initiator column will show you how a resource came to be, and what I mean by this is who requested that resource. So in the case of a CSS file, chances are it was probably requested because of a link tag, and as you can see our assumptions are correct. The link tag was highlighted right as we landed on the file. So I'll go back to the Network panel and I'll look at the Initiator for some JavaScript. Unsurprisingly it's a script tag. But now let's do something more complex. Now, in the case of this denim.png, we actually get a core stack of how this resource came to be. So we see the individual cores that occurred for that resource to be initiated. So that's all for now but just to recap, we've got a few filtering options here. You've got Advanced Filtering and Basic Filtering. We've got the ability to toggle the view of the resource items. You can click on the resource item, you can get a Preview, click the information, Header information. Previews are pretty useful because you get a preview of the image as well. It's not just text-based. This waterfall diagram is very useful for finding out what scripts are blocking if any, and blue is DOMContentLoaded, red is Load. But this information is also reiterated to us right at the bottom. Don't forget that each item has a context menu where you can right-click and do a bunch of interesting things. We don't look at HAR, which is HTTP Archive, but do have a search for that if you are interested. We can Copy the Request and Response Headers, and that will go straight into our Clipboard, ready for sending to someone else, for example. And finally, there are a number of interesting columns to enable by right-clicking on the columns and just selecting various things. Thanks for watching. I'll see you later.


