
 Lessons: 15Length: 1.5 hours
- Overview
- Transcript
3.4 Layers and Rendering
We’ll dive even deeper into rendering performance by taking a look at the new Layers and Rendering Panels, to understand how performance issues can be effectively diagnosed.
Related Links
1.Introduction
1.1Introduction02:45
2.Development Workflow
2.1Elements10:58
2.2Sources and CSS06:26
2.3Sources and JavaScript07:55
2.4Console06:12
3.Performance
3.1Network06:28
3.2Timeline07:13
3.3Profiles04:38
3.4Layers and Rendering10:08
3.5Audits04:07
4.DevTools and Mobile
4.1Emulation03:23
4.2Remote Debugging06:41
4.3Responsive Design05:21
5.The Resources Panel
5.1Resources02:31
6.Conclusion
6.1Extensions and Conclusion05:57
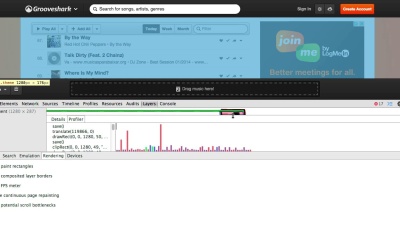
3.4 Layers and Rendering
Hello everyone, and welcome to this lesson on the layers panel, and the rendering panel. Both the panels we're going to be talking about are kind of experimental, so do keep in mind that things can totally change, from the features to the UI. Regardless, there's still features that are worth knowing about right now. So let's have a look. I'll open up the DevTools and I'll head on over to the Layers panel. I got access to this panel by going to Settings, Experiments, and checking the Layers panel. I'll close that, but before we look at a panel, let's talk about what a layer is. A layer is a sort of internal representation of your page. We as web developers are more familiar with dominance, what we see when we go to the elements panel. Internally, drawing that dome, and actually getting it painted on your page, utilizes layers a lot, and if you want to read more about that, check out Accelerated Rendering in Chrome, which is an article posted on HTML 5 rocks which goes into a lot more detail. What the layers panel will essentially show you, is a 3D representation of layers. Here, I'm on a really simple page. If I scroll the page, the layers are a bit more evident. See that table of contents, here? Well, that's actually on its own layer, and we can verify that by seeing it here. We get quite a few bits of interesting information. We get the coordinates of the element. The size, also known as the dimensions. We get the reason, that it's being composited. And as you can see, if I hover over that, I get a bit more information as to why it's been composited onto its own layer. We get a memory estimate and you want to watch out that these aren't too high, especially in comparison with the size of it. You get the number of times it's been painted. One big benefit of having something in its own layer, is that it doesn't really have to be painted too much. Since the GPU can just move it very cheaply and efficiently. I can actually zoom in with the mouse wheel, so I'm just scrolling with the mouse wheel and that zooms in here. I can also right click and select reveal in elements panel, but as you just saw, hovering over it also shows you where it is on the page. Did you know you can also single click and that will reveal it right here. So this kind of gives you a tree like structure of all the layers. One pretty nice feature which is also really new, is the ability to double click on a layer and have that rendered and this also highlights the paint profiler. These give you the individual draw operations which occurred to get that layer painted. This is quite nice and low level for us as web developers. You've got a view that's similar to the time line panel in a sense you can, select bars and so I'll pan around. And by the way, you can also hover over these draw calls and you'll get this little tool tip with the individual method parameters that were passed. So again, don't worry if you don't find this entirely useful to you. But it's at least worth being aware of what is available here. If anything, I would definitely just stick with the details pane, and making sure that the things that should be layers, are layers, and that I at least don't have millions of them on the page. Because the more layers you have, the more you eat into your GPU memory. That HTML5 rocks article was a really simple example for looking at layers, but also maybe not so useful. Here I am on a CSS3 3D transform stemer. Now if I open up the layers panel here, not only does it looks interesting, but it's also kind of useful in the sense that we can verify all these elements. To which are being animated are indeed layers, I can also double click and you see that's rendered. For this in particular, the details pane should make a fair amount of sense when it comes to compositing reasons. We have transform 3D, indeed is we right click, reveal in elements panel, we can see a translate Z has been applied. Let's take a look at more complex example. Here I am on the Grooveshark website, a website used for listening to music. I'm on a page called Popular, which lists popular tracks. And as you can see, it's a fairly complex page, you've got this fixed header and footer, you've got an advertisement, you've got main navigation and sub navigation, each of these rows have a bunch of functionality behind them. So there is a lot going on. Let's have a look at the latest with this. Hello, well, understandably, there are a lot of layers here and we can see that's the header. If I double click on that, you can see it's been rendered. I can also reveal that in the elements panel. But I think we're already familiar with layers now. Let's go on to the rendered panel. I'll hit escape to bring up this drawer and as you can see, I have multiple trap boxes. The main functionality behind these trap boxes, is to apply small indicators to your page. So for example, I have this FPS meter and clicking on it puts this little frames per second meter, in the top right corner of my page. As you can guess this is most useful for performance testing. I'll enter it there and we'll take a look at show pink rectangles. Now I want you to try to associate pink rectangles with something which harms performance. Painting is generally a costly thing. Thing, especially on low-end devices. Remember when we were looking at the timeline panel, we would start recording, scroll the page, and a lot of the things which took time was indeed painting. And as you can see here, indeed painting did take a fair amount of time, and this is also on a powerful machine. So imagine what it would. It would be like on a mobile device. Anyway the thing I really want to show you here, is what exactly it does by checking it. So when you check show paint rectangles, you can do actions like scrolling the page and what will happen is, it will show you what parts of the page are being painted. As you can see, if I scroll, the header and footer don't flash green, therefore are not being re-painted. But here's something interesting. If I hover over this, can you see how that trash icon does indeed flash green. Let me turn off this, and hover over it again. As you can see, not only do we have the tool tip, but the icon also slightly changes it's gradient. Therefore, in this case it doesn't need to be painted again. So that makes sense. So the key point to take away here, is that we want to try and avoid painting when possible. If something doesn't change every time you scroll the page. It's totally suitable for its own layer, and one way of doing that is the translate Z hack. And that's also how, the header and footer came to be on their own layers. So if I close this drawer, you can see not only is the header on, on its own layer but so is the footer. And this is generally a good thing. And we can also verify that the header and footer. On their own layers by inspecting the styles and seeing that there's a translate z applied to that player. Which I'm also referring to as the footer. What else do we have in the rendering panel? We have composited layer borders. Now we spoke a lot about how painting isn't a great thing for your page. Well how do you know if you've successfully put something onto it's own layer? You can check show composited layer borders, and can you see that orange? I'm gonna actually zoom into this page. See this orange border around the footer and the header? Well guess what, these boarders are indicators to us that these elements have successfully. Successfully been put onto their own layers, and this is perfect because they're not changing, they don't need to be painted continuously. I'll zoom out and uncheck that. Oh, by the way, these blue borders aren't so important. I think that's just related to the tiles that Chrome uses internally, again it's really the orange bodies that we care about. FPS meter, we just had a look at that. Continuous page repainting, this is a really fun one. If the scrolling of your page is stuttery and slow. I highly recommend that you enable continuous page repainting. What we'll do is that we'll force Chrome to continuously paint your page, and we can verify that by selecting show paint rectangles and can you see how everything is going green? Well, that's because everything is being painted to continuously. Of course, this is only meant for developers. So what I'll do is I'll uncheck that. The page is still being painted continuously and check this out. So if I hide the body by pressing H, you can see that paint time has dropped and this totally makes sense. There's not much to paint on the page right now, therefore it should take no time at all to actually paint the page. If I show that again, by hitting H, we can see paint time increases and you get a minimum and maximum range. Scrolling the page will typically increase the paint time. Now I'd like to give a very small yet slightly more practical example about painting and having things on their own layers. Here I am on this random product page on Logitech, and I want us to take a look at show paint rectangles. So I'm gonna open up rendering, get rid of enable continuous page repainting, and enable show paint rectangles. Now, here's where it gets interesting. If I scroll the page, forget about the scroll bar, by the way. That's not important. But notice that feedback button on the right-hand side. Right over here. Can you see how every time I scroll, it's being pre-painted. Well, this is not efficient. Let's dig into this a bit more. I'll uncheck that. Close this drawer, get a time line, start recording, scroll a tiny bit, and as you can see, there's a pink record. Just by hovering over that pink record we can indeed confirm that it's that feedback button which has caused this pink record to occur. And remember what we were talking about earlier? How painting isn't an ideal. Now I know that this self time is nothing at all. But again, always think about smaller devices and low end devices where painting is a lot more costly. You might think that trying to fix this problem is a bit of a micro-optimization, but in the long run it ensures that our pages are more suitable across a wide range of devices no matter how powerful they are. So what can we do about this little feedback button. The problem is, it doesn't need to be painted each time we scroll. It's just sitting there. It's completely fixed. It's not moving whatsoever. So I'll uncheck that and I'll ins, I'll inspect that element, close that drawer, and here we have the image in question. What I'll do is I'll apply the translate Z hack just like that. First of all, we can verify it's been promoted to its own layer by going to the layers panel. And indeed we can see it right there. I can select it, right click review elements panel. Indeed there it is. And I can go back and I can verify that that is the correct element, if we go to details it confirms the reason the it's promoted to it's own layer, is because of that 3D hack, and finally let's track show paint rectangles, I'll scroll the page. And isn't that nice, it's not being painted. Again, ignore the scroll bar. The important part is that feedback button doesn't change whatsoever, therefore, it doesn't need to be repainted each time we scroll the page. I'll uncheck that. And lastly, I'll just do a timeline recording. I know it's a big fuss for such a small button. I'll scroll the page a tiny bit. And check that out. Out of all these records, there are no paint records whatsoever. So just by applying the translate Z hack to that feedback button, we've promoted it to its own layer, which meant it didn't need to be repainted on each scroll of the page. We verified that not only by going to the layers panel but also by checking show paint rectangles in the rendering panel, where we could verify that it wasn't being painted, continuously. And finally, when we did that very small timeline recording, we could see that there were no paint records whatsoever. So that was a small, yet what I consider to be, significant win. While the translate Z hack may seem like a bit of a magic win, it's important to keep in mind that too many translate Zs could be bad, because you can very easily eat up into your GPU memory limit. So, it's really about finding a nice balance between what should be permitted to its own composited layer and what shouldn't. But more importantly, actually using the timeline panel to verify a performance is increasing rather than decreasing, and don't forget, when you enable continuous page painting, you'll actually get the time it takes to paint your page. Try hiding visual styles on elements like border radius and box shadow to see how that effects the painting. If you get a little luck with that, try promoting things to their own layers where it makes sense, and seeing if that helps. Thanks for listening, I'll see you later.


