
 Lessons: 15Length: 1.5 hours
- Overview
- Transcript
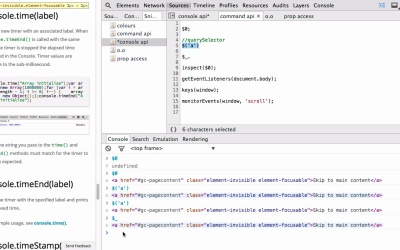
2.4 Console
Being able to inject JavaScript into the current page allows us to debug and experiment fairly easily. Let’s have a look at some snippets of code we can use to do just that.
Related Links1.Introduction
1.1Introduction02:45
2.Development Workflow
2.1Elements10:58
2.2Sources and CSS06:26
2.3Sources and JavaScript07:55
2.4Console06:12
3.Performance
3.1Network06:28
3.2Timeline07:13
3.3Profiles04:38
3.4Layers and Rendering10:08
3.5Audits04:07
4.DevTools and Mobile
4.1Emulation03:23
4.2Remote Debugging06:41
4.3Responsive Design05:21
5.The Resources Panel
5.1Resources02:31
6.Conclusion
6.1Extensions and Conclusion05:57
2.4 Console
Hey welcome back. In this lesson, we'll take a look at the console panel. Now this isn't strictly the console panel itself, but rather the ability to inject JavaScript into the current page. So I've already got a few scripts lined up to show you, and all I'm gonna do is I'm gonna sorta take some from here and paste it in here. Just so you can see. But with what we're going to cover keep in mind that the console and the snippets feature in the sources panel is very, very similar. I've already shown this, but just to give you a little taste of what is possible. If I run this snippet we get a list of colors which are used in the current page. So there are some very cool snippets out there and you can find them at this repository. Okay I'm gonna clear what's in the current console by hitting the clear button. I'm gonna close this tab. To start out let's run this clip. I'm using the shortcut command and enter but you can also right click and select Run. First off, this is just to demonstrate the console to error function and how it gives you a stack trace of the cause that led up to the current error. As you can see, errorFuncWrapper was called and that calls errorFunc and that is reflected here. And keep in mind, the ability to click on the line numbers still works. Listener bits. Next, we've got console.group. This is a nice way to make your log messages a bit more tidy if you are logging a large amount. You call console.group and pass a string. That string is the title of your group. From that point on, all subsequent log messages will be part of that group. Finally, when you're done, you can call console.groupEnd. You might notice how one of the log messages is in green. This is made possible with the percentage C modifier. When you use percenter, you can parse some arbitrary CSS as a second argument. Note that you are limited in what CSS properties you can use here. And finally as part of the console API, this is console.time. As you can see, you call console.time and console.timeend with the same string, everything in-between is time. So here i've got a very simple for loop which is not doing anything whatsoever, but this i variable still has to increment. Here it took 0.813 milliseconds. If I add a few zeros, as you can see it took significantly longer. So this is a really good snippet for profiling your code. Now what we've just looked at isn't an exhaustive list of what's in the console API. I just wanted to give you a taste of a few things that are available. If you do a search for developer tools console API, you'll find the official documentation which has a heap of examples. Okay, now let's look at the command line API. Did you know, you can use dollar zero to get the currently selected element in the elements panel? Right now, I don't have any elements selected, so let's go to the elements panel, make sure one's selected, come back. And i'll re-run that and as you can see, it's showing me the currently selected element, which is really useful. I can also right click and select reveal in elements panel to go back to the elements panel. So we'll go back, now I wanna you show you this. And if you've used jQuery, you might be familiar with this. In the [UNKNOWN] tools this is simply an alias to query selector. So here I'll select the first anchor tag. Okay. Cool. Now as you might have noticed we do get auto complete in the console panel and this is great for exploring what properties and what methods are available on an object. But what about the previous command I ran. Why didn't I get a value for that? That's because this isn't defined yet. This is a method we are calling. So here's a little trick. You can use the shortcut $_ to get the value of the last evaluated bit of code. And because $_ is now defined, I can actually do dot and suddenly I do get auto-complete, so that's a little shortcut. Calling the inspect method is basically the same as right clicking on a dumb node here and selected reveal and element panel. Get event listeners is really powerful, it allows you to pass a dumb node to the function get event listeners. And in return. Let me just clear this. And in return, we get the list of event listens which are registered on the download we passed in. Here I can see key down. Here's the list number, this isn't very helpful. Function e. So what I can actually do here is right-click and select Show Function Definition. And as you can see, I'm taken straight to the piece of code which registered the event listener on this webpage. So that's it from the command line APA. Keys is handy one to know. You pass an object, and it will simply list all the keys in the nory. Likewise, there's also a values function that will return all of the values of an object you're passing. Monitor events is another really good one to know. Let's say you want to know what the event object looks like in your call back. For example, when you add in an event list for scrolling. Well here, pass the object in question, and we pass the event we want to listen for. Execute that and notice when I start scrolling, all the events are logged. So this is a really quick way to register an event that's not on an object. By the way, like in many panels of the devtools, you can use Command+F to do a search. So here I'll search for scroll, and that's showing up here. Now if you've noticed, a lot of what we've just been covering is really good for debugging from the outside in. For example, getEventListeners is super useful when you don't know what Event Listeners the current page has registered. I wanna show you something cool. Using object to observe, we can actually pause at the VA debugger every time a property is changed on an object that we care about. So i'm gonna execute this bit of code, now I have this watch me variable in the global script, I'm gonna change the property of it. Now, as you can see just like that the de-bugger has paused. Now this is really useful, as you can imagine you really want to find out how an object is being modified. Now this is good for setting values, what about getting values? I'm gonna continue here. Go to prop access. There's a little trick. Using object.define property, we can find out whenever a property is accessed which is incredibly powerful. Remember in the timeline panel lesson how we were noticing that certain retrieval or property values can cause all sorts of performance issues? For example, getting an element offset can cause a recalculate style. Let me execute this bit of code. Now let's say I access the scroll top property of the document.body object. What's gonna happen? As you can see, because we've defined a custom getter and setter, the debugger has successfully paused. So the command and console API aside, I hope you've seen a few interesting techniques that we can use to debug our JavaScript code. Don't forget this is all documented. Oh, and by the way, as for the console panel itself, I've brought this up by hitting the escape key and it's available as part of this drawer. And you can also choose the context at which you wish your JavaScript to be evaluated [UNKNOWN] useful for when you have I-frames. And finally, there's this filter option. You can filter by the type of console message and even supply some custom projects.


